https://support.sas.com/documentation/cdl/en/statug/63033/HTML/default/viewer.htm#statug_ods_sect017.htm
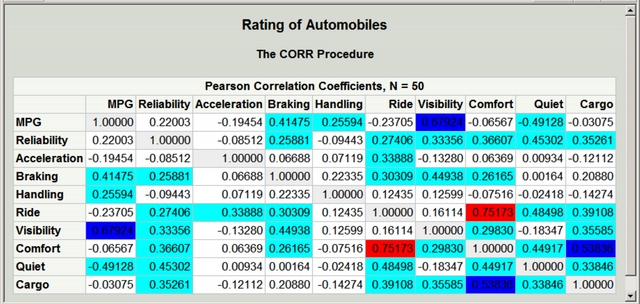
This graph displays the rating of automobiles in a correlation matrix. This displays the relationship between the rating of certain components of automobiles, displaying corresponding values under each column. Qualifying as a correlation matrix, it contains correlation coefficients among several markets in different timeframes.


